Comparing Results of MATLAB and Seismosignal in Plotting Earthquake Graphs
Alireza Kamrava1 *
1
Student of Earthquake Engineering, Department of Environment and Cvil Engineering,
Campus of Shiraz university of Technology,
Shiraz,
Iran
http://dx.doi.org/10.12944/CWE.10.Special-Issue1.02
In this paper I teach how to find, Save and open Acceleration vs. Period, Velocity Vs. Period and Displacement Vs. Period data files by using Peer Berkley’s earthquakes database website and Notepad. Then Using MATLAB to draw Acceleration vs. Period(A-T), Velocity Vs. Period (V-T) and Displacement Vs. Period(D-T) graphs in one sheet of paper, save with . jpeg or other formats and print them. Then Using Seism signal V4. 3 to draw previous graphs. You will learn the definition and difference of accelerogram and seismogram too.
Copy the following to cite this article:
Kamrava A. Comparing Results of MATLAB and Seismosignal in Plotting Earthquake Graphs. Special Issue of Curr World Environ 2015;10(Special Issue May 2015). DOI:http://dx.doi.org/10.12944/CWE.10.Special-Issue1.02
Copy the following to cite this URL:
Kamrava A. Comparing Results of MATLAB and Seismosignal in Plotting Earthquake Graphs. Special Issue of Curr World Environ 2015;10(Special Issue May 2015). Available from: http://www.cwejournal.org/?p=10675
Download article (pdf)
Citation Manager
Publish History
Introduction
In today world we will see the fast speed of technological development. One of these technological development is in engineering softwares. Each earthquake engineer knows MATLAB and seismosignal, The two famous software’s. MATLAB use acceleration data to plot A-T graphs and velocity, displacement data to plot V-t and D-T graphs. But Seismosignal use acceleration data file only and plot three previous graphs. SO it uses formulas to calculate velocity and displacement data. I think that the user did not know seismosignal formulas so use the following Earthquake data to check whether both software’s have the same results or not by checking graphical, PGA, PGV and PGD results. But first I would like you to know short definition of accelerograph and seismograph before start using software’s. Here I use Cape Mendocino 1992 04 25 1806 CPM090Data files as a sample of my research. I cannot write all of them here since limit in number of pages
Accelerogram
Accelerogram is Earthquake ground motion acceleration data which recorde by acclelerograph and could be use to design structures by Earthquake and Structural engineers.
Seismogram
Seismogram is earth displacement datas while occurring earthquake which record by seismograph and could be use to know geological information like plates layers thicknesses.
Save Earthquake information’s Using Peer Berkley Web Site and Plot Graphs in Seismo Signal
First search and open " http://peer. Berkeley. edu/smcat/search. html" in your internet browser. Then fill out the form and click on search bottom. (Fig. 1)
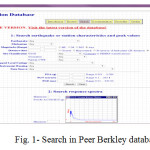 |
Fig. 1: Search in Peer Berkley database Click here to View figure |
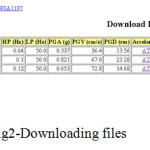
In next page click on the one of record ID. s. In next page click on Acceleration, Velocity and dis placement for each component and save them with . txt format. By using note pad you could open Data files. (Fig. 2)
 |
|
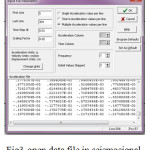
Know open seismosignal and open data file. In appearing window after click on open key you can insert time step, line numbers and etc. (Fig. 3)Be sure that you open acceleration data file in seismosignal.
 |
|
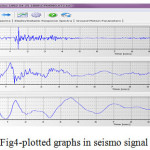
By click on ok button graphs will plot(Fig. 4). In left you can control and copy period and data of each r graphs in right.
 |
|
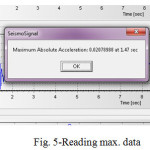
By doubble click on each graph you can see max. data and its time. (Fig. 5)
 |
|
Plot graphs in MATLAB
In MATLAB define two matrixes which contains period and data('For example acceleration'). then use subplot and plot functions to plot graphs. you can use labe and title functions to labeling and titling graphs as following instructions.
A=[a d f];
B=[a d f];
C=[a d f];
D=[a d f];
subplot(x, y, p1);
plot(A, D);
title('title1');
xlabel('xlabel1');
ylabel('ylabel1'),
subplot(x, y, p2);
plot(B, D);
tltle('title2');
xlabel('xlabel2');
ylabel('ylabel2'),
subplot(x, y, p3);
plot(C, D);
tltle('title3');
xlabel('xlabel3');
ylabel('ylabel3'),
A, B, C, D are acceleration, velocity, displacement and period data matrixes. a, d, f are data. In subplot function x, y are number of rows and columns. p1-p3 are graph positions and numbers. In title functions title1-title3 are your graphs title and in xlabel function, xlabel1-xlabel3 are x-axis names. ylabel function has the same order with xlabel function. In plot function C, D or A, D and B, D are in(data, period) format.
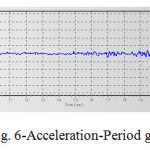
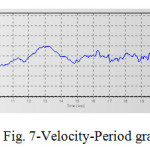
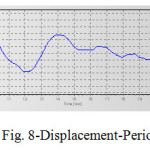
Seismo signal Graphs
 |
|
 |
|
 |
|
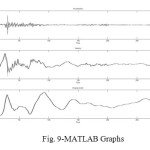
MATLAB Graphs
 |
|
Comparing Results
Table1: Comparing results
|
Programme |
PGA(cm/s^2) |
PGV(cm/s) |
PGD(cm) |
PGA Time(sec) |
PGV Time(sec) |
PGD Time(sec) |
|
MATLAB |
1. 0395 |
42. 0546 |
12. 3988 |
- |
- |
- |
|
Seismosignal |
1. 039494 |
41. 32197551 |
12. 58882553 |
2. 94 |
2. 5 |
9. 12 |
There is a question that why MATLAB could not Plot graph as same as Seismosignal and calculate time, even you may see error when insert period in matrixes. The answer is MATLAB is not Earthquake engineering programmed and it is mathematical base programmed. So it count numbers of data, use them as time and use statistical formulas like average and standard deviation to draw graphs.
Conclusion
As you see in Table1, Table2, Fig. 9 and Fig. 10 after correcting graphs there are little differences in graphs since MATLAB use statistical and mathematical formulas but Seismo signal use engineering formulas. So we it is better that use special program for their own purposes. For example use seismosignal for drawing accelerograph, calculating PGA, PGV and PDG; and use MATLAB for solving mathematical problems. If we use Seismo signal, we can use its data file in designing program like CSI ETABS since it draw correct and exact graphs and create exact data file but MATLAB cannot be use since it is not Earthquake engineering program.
References
- Dr. KH. Bargi, Fundamentals of Earthquake Engineering, University of Tehran Press, 2012 pp. 37
- Pakniyat shayan and Pakniyat Ehsan, Essential Analyses for Seismic Rehabilitation of Structures, Motefekaran publication, Tehran, Iran pp. 237-243
- Seismosignal V4. 3 user manual
- MATLAB 2010b user manual


